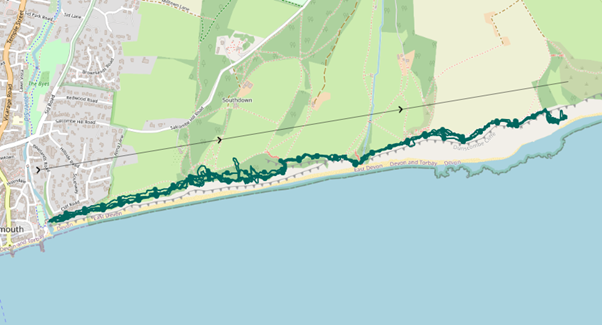
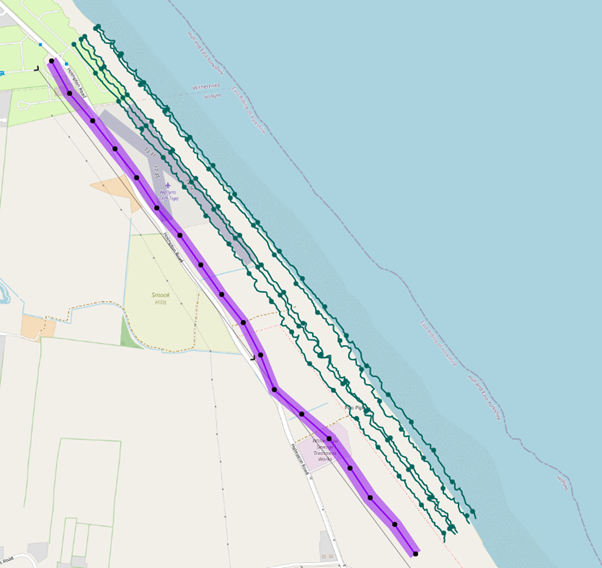
Cliff Erosion & DSAS Prediction · Withernsea
Multi-temporal cliff-line mapping (2003–2025) with custom Python tools and DSAS. Mean retreat 4.72 m/yr across 18 transects (all R² ≥ 0.99). A 20-year projection of 80–113 m.
PORTFOLIO · 06 CASE STUDIES
Six case studies covering thermal imagery, glaciers, coastal change, hydrology, and cartography. These aren't just screenshots. For each one I've written up the question, the method, and what I actually found.

Multi-temporal cliff-line mapping (2003–2025) with custom Python tools and DSAS. Mean retreat 4.72 m/yr across 18 transects (all R² ≥ 0.99). A 20-year projection of 80–113 m.

The same DSAS method on a defended, hard-rock coast. Mean LRR 0.20 m/yr at R² 0.34, which shows how sea defences scramble the erosion signal.

Grinnell Glacier between 2009 and 2016. It lost 9.09% of its area, measured from free satellite imagery.

Hierarchical multi-criteria GIS combining physical, environmental and social layers. Site B (Bow Street) recommended.
A full raster hydrology run on an SRTM DEM: fill, flow direction, accumulation, Strahler stream ordering, and watershed delineation across the Dovey catchment.

NASA ARSET training: ECOSTRESS land surface temperature in Google Earth Engine, Random-Forest sharpening to 10 m, and a nighttime urban-heat-island analysis in R.
Analysis of shoreline change across the entire Holderness Coast. Details to be confirmed.